反调试技术例题
我们现在来分析一道2016年SecCon的anti-debugging题, 题目下载链接: bin.exe
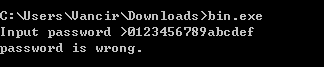
这是一个32位的PE文件, 是一个控制台程序, 我们直接运行, 会要求输入password. 当你输入一个错误的password时则会提示你password is wrong.
我们用IDA打开来看下, 最快速的方式就是直接查看字符串, 根据password is wrong找到关键代码. IDA显示的结果如下图:
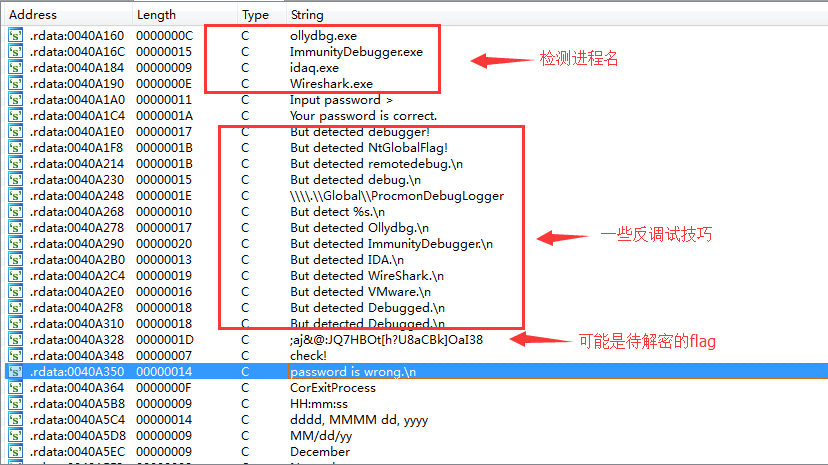
显然, 字符串表明程序中可能有各种检测, 比如检测进程名ollydbg.exe, ImmunityDebugger.exe, idaq.exe和Wireshark.exe. 然后也有其他的检测. 我们也看到了字符串password is wrong和You password is correct的字样. 同时还发现了一个很有可能就是待解密的flag的字符串. 那么我们就先根据password is wrong的交叉引用来到关键函数处.
如下所示: 程序果然使用了大量的反调试技巧.
int __cdecl main(int argc, const char **argv, const char **envp)
{
  v23 = 0;
  memset(&v24, 0, 0x3Fu);
  v22 = 1;
  printf("Input password >");
  v3 = (FILE *)sub_40223D();
  fgets(&v23, 64, v3);
  strcpy(v21, "I have a pen.");
  v22 = strncmp(&v23, v21, 0xDu); // 1. 直接比较明文字符串与输入字符串
  if ( !v22 )
  {
    puts("Your password is correct.");
    if ( IsDebuggerPresent() == 1 )     // 2. API: IsDebuggerPresent()
    {
      puts("But detected debugger!");
      exit(1);
    }
    if ( sub_401120() == 0x70 )         // 3. 检测PEB的0x68偏移处是否为0x70. 检测NtGlobalFlag()
    {
      puts("But detected NtGlobalFlag!");
      exit(1);
    }

    /*  BOOL WINAPI CheckRemoteDebuggerPresent(
     *    _In_    HANDLE hProcess,
     *    _Inout_ PBOOL  pbDebuggerPresent
     *  );
     */
    v4 = GetCurrentProcess();
    CheckRemoteDebuggerPresent(v4, &pbDebuggerPresent);
    if ( pbDebuggerPresent )            // 4. API: CheckRemoteDebuggerPresent()
    {
      printf("But detected remotedebug.\n");
      exit(1);
    }
    v13 = GetTickCount();
    for ( i = 0; i == 100; ++i )
      Sleep(1u);
    v16 = 1000;
    if ( GetTickCount() - v13 > 1000 )  // 5. 检测时间差
    {
      printf("But detected debug.\n");
      exit(1);
    }
    lpFileName = "\\\\.\\Global\\ProcmonDebugLogger";
    if ( CreateFileA("\\\\.\\Global\\ProcmonDebugLogger", 0x80000000, 7u, 0, 3u, 0x80u, 0) != (HANDLE)-1 )
    {
      printf("But detect %s.\n", &lpFileName);      // 6. 检测ProcessMonitor
      exit(1);
    }
    v11 = sub_401130();     // 7. API: CreateToolhelp32Snapshot()检测进程
    if ( v11 == 1 )
    {
      printf("But detected Ollydbg.\n");
      exit(1);
    }
    if ( v11 == 2 )
    {
      printf("But detected ImmunityDebugger.\n");
      exit(1);
    }
    if ( v11 == 3 )
    {
      printf("But detected IDA.\n");
      exit(1);
    }
    if ( v11 == 4 )
    {
      printf("But detected WireShark.\n");
      exit(1);
    }
    if ( sub_401240() == 1 )    // 8. 通过vmware的I/O端口进行检测
    {
      printf("But detected VMware.\n");
      exit(1);
    }
    v17 = 1;
    v20 = 1;
    v12 = 0;
    v19 = 1 / 0;
    ms_exc.registration.TryLevel = -2;  // 9. SEH
    printf("But detected Debugged.\n");
    exit(1);
  }
  printf("password is wrong.\n");
  return 0;
}
我在代码里写了注释, 列出了其中所使用的9个保护技术部分. 我们来逐一分析一下吧.
比较明文字符串
printf("Input password >");
v3 = (FILE *)sub_40223D();
fgets(&v23, 64, v3);
strcpy(v21, "I have a pen.");
v22 = strncmp(&v23, v21, 0xDu); // 1. 直接比较明文字符串与输入字符串
if ( !v22 )  {
    ......
}
这里就是输出Input password >. 然后用fgets()获取用户输入的字符串, 将I have a pen.复制到v21的缓冲区中, 然后用strncmp比对用户输入与I have a pen.的内容, 并将比较结果返回给v22. 以下会根据v22, 也就是根据输入的password是否正确, 而进行跳转.
IsDebuggerPresent()
puts("Your password is correct.");
if ( IsDebuggerPresent() == 1 )     // 2. API: IsDebuggerPresent()
{
    puts("But detected debugger!");
    exit(1);
}
显然, 输入的password正确, 就会输出提示Your password is correct.. ??? 不觉得奇怪吗. 难道I have a pen.就是我们的flag了吗? 不不不当然不是. 这其实是一个陷阱, 既然你知道了I have a pen.那么就肯定有通过某种逆向手段在对程序进行分析. 所以接下来的部分就开始进行一些反调试或其他的检测手段(实际中也可以出现这样的陷阱).
一开始的是IsDebuggerPresent(), 根据返回结果判断是否存在调试.如果不太清楚的话, 可以返回去看 IsDebuggerPresent() 篇
NtGlobalFlag
接下来是检测NtGlobalFlag这个字段的标志位. 通过检测PEB的字段值是否为0x70来检测调试器, 如果不太清楚的话, 可以返回去看 NtGlobalFlag 篇
if ( sub_401120() == 0x70 )         // 3. 检测PEB的0x68偏移处是否为0x70. 检测NtGlobalFlag()
{
    puts("But detected NtGlobalFlag!");
    exit(1);
}
那我们来简单看一下sub_401120()好了
int sub_401120()
{
  return *(_DWORD *)(__readfsdword(48) + 0x68) & 0x70;
}
0x68是PEB的NtGlobalFlag字段对应偏移值. 0x70是FLG_HEAP_ENABLE_TAIL_CHECK (0x10), FLG_HEAP_ENABLE_FREE_CHECK (0x20) 和FLG_HEAP_VALIDATE_PARAMETERS (0x40)这三个标志
CheckRemoteDebuggerPresent
/*  BOOL WINAPI CheckRemoteDebuggerPresent(
 *    _In_    HANDLE hProcess,
 *    _Inout_ PBOOL  pbDebuggerPresent
 *  );
 */
v4 = GetCurrentProcess();
CheckRemoteDebuggerPresent(v4, &pbDebuggerPresent);
if ( pbDebuggerPresent )            // 4. API: CheckRemoteDebuggerPresent()
{
    printf("But detected remotedebug.\n");
    exit(1);
}
CheckRemoteDebuggerPresent()这个API的函数原型. 如果检测到调试器的存在, 会将pbDebuggerPresent设置为一个非零值. 根据其值检测调试器(CheckRemoteDebuggerPresent() 篇)
时间差检测
v13 = GetTickCount();
for ( i = 0; i == 100; ++i )    // 睡眠
    Sleep(1u);
v16 = 1000;
if ( GetTickCount() - v13 > 1000 )  // 5. 检测时间差
{
    printf("But detected debug.\n");
    exit(1);
}
GetTickCount会返回启动到现在的毫秒数, 循环里光是sleep(1)就进行了100次, 也就是100毫秒. 两次得到的时间作差如果大于1000毫秒, 时差明显大于所耗的时间, 也就间接检测到了调试.
ProcessMonitor
lpFileName = "\\\\.\\Global\\ProcmonDebugLogger";
if ( CreateFileA("\\\\.\\Global\\ProcmonDebugLogger", 0x80000000, 7u, 0, 3u, 0x80u, 0) != (HANDLE)-1 )
{
    printf("But detect %s.\n", &lpFileName);      // 6. 检测ProcessMonitor
    exit(1);
}
这里通过检测设备文件\\\\.\\Global\\ProcmonDebugLogger来检测ProcessMonitor
检测进程名
这里通过执行sub_401130()函数来检测进程, 并根据检测到的不同进程, 返回相应的值.
v11 = sub_401130();     // 7. API: CreateToolhelp32Snapshot()检测进程
if ( v11 == 1 )
{
    printf("But detected Ollydbg.\n");
    exit(1);
}
if ( v11 == 2 )
{
    printf("But detected ImmunityDebugger.\n");
    exit(1);
}
if ( v11 == 3 )
{
    printf("But detected IDA.\n");
    exit(1);
}
if ( v11 == 4 )
{
    printf("But detected WireShark.\n");
    exit(1);
}
我们就来看一下sub_401130()函数
signed int sub_401130()
{
  PROCESSENTRY32 pe; // [sp+0h] [bp-138h]@1
  HANDLE hSnapshot; // [sp+130h] [bp-8h]@1
  int i; // [sp+134h] [bp-4h]@1

  pe.dwSize = 296;
  memset(&pe.cntUsage, 0, 0x124u);
  hSnapshot = CreateToolhelp32Snapshot(2u, 0);
  for ( i = Process32First(hSnapshot, &pe); i == 1; i = Process32Next(hSnapshot, &pe) )
  {
    if ( !_stricmp(pe.szExeFile, "ollydbg.exe") )
      return 1;
    if ( !_stricmp(pe.szExeFile, "ImmunityDebugger.exe") )
      return 2;
    if ( !_stricmp(pe.szExeFile, "idaq.exe") )
      return 3;
    if ( !_stricmp(pe.szExeFile, "Wireshark.exe") )
      return 4;
  }
  return 0;
}
这里使用了API: CreateToolhelp32Snapshot来获取当前的进程信息. 并在for循环里依次比对. 如果找到指定的进程名, 就直接返回相应的值. 然后根据返回值跳转到不同的分支里.
检测VMware
检测VMware也是检测一些特征. 根据检测的结果进行判断.
if ( sub_401240() == 1 )    // 8. 通过vmware的I/O端口进行检测
{
    printf("But detected VMware.\n");
    exit(1);
}
来看sub_401240()函数.
signed int sub_401240()
{
  unsigned __int32 v0; // eax@1

  v0 = __indword(0x5658u);
  return 1;
}
这是VMware的一个"后门"I/O端口, 0x5658 = "VX". 如果程序在VMware内运行, 程序使用In指令通过0x5658端口读取数据时, EBX寄存器的值就会变为0x564D5868(0x564D5868 == "VMXh")
看IDA反编译出的伪C代码并不很直观地体现这点, 我们看汇编代码就清楚了
.text:0040127A                 push    edx
.text:0040127B                 push    ecx
.text:0040127C                 push    ebx
.text:0040127D                 mov     eax, 564D5868h   //  <------
.text:00401282                 mov     ebx, 0
.text:00401287                 mov     ecx, 0Ah
.text:0040128C                 mov     edx, 5658h   //  <------
.text:00401291                 in      eax, dx
.text:00401292                 pop     ebx
.text:00401293                 pop     ecx
.text:00401294                 pop     edx
更多阅读: E-cards don?t like virtual environments
SEH
v17 = 1;
v20 = 1;
v12 = 0;
v19 = 1 / 0;    // 9. SEH
ms_exc.registration.TryLevel = -2;
printf("But detected Debugged.\n");
exit(1);
接下来这一段, 很奇怪不是吗. 这里v19 = 1 / 0;明显是不合常理的, 会产生一个除零异常. 而后面的ms_exc.registration.TryLevel = -2;这是解除异常, TryLevel=TRYLEVEL_NONE (-2) . 来看汇编代码.
.text:004015B8                 mov     [ebp+var_88], 1
.text:004015C2                 mov     [ebp+var_7C], 1
.text:004015C9                 mov     [ebp+var_9C], 0
.text:004015D3                 mov     [ebp+ms_exc.registration.TryLevel], 0
.text:004015DA                 mov     eax, [ebp+var_7C]
.text:004015DD                 cdq
.text:004015DE                 idiv    [ebp+var_9C]
.text:004015E4                 mov     [ebp+var_80], eax
.text:004015E7                 mov     [ebp+ms_exc.registration.TryLevel], 0FFFFFFFEh
.text:004015EE                 jmp     short loc_40160A
在这里的idiv [ebp+var_9C]触发异常后就由程序注册的异常处理函数接管, 而如果没有在异常处理程序入口设下断点的话, 程序就容易跑飞.
获取flag
但整个看下了. 怎么感觉关flag一点事都没有了呢? 还有没有记起之前在字符串窗口看到的疑似是那个待解密的flag的字符串? 实际上由于IDA反编译的限制, 使得反编译出的伪C代码并不正确. 比如在最后一段的printf("But detected Debugged.\n");这里, 我们来看具体的汇编代码.
.text:00401627                 call    sub_4012E0
.text:0040162C                 movzx   eax, ax
.text:0040162F                 mov     [ebp+var_A8], eax
.text:00401635                 cmp     [ebp+var_A8], 0      // <------
.text:0040163C                 jz      short loc_401652     // <------
.text:0040163E                 push    offset aButDetectedD_2 ; "But detected Debugged.\n"
.text:00401643                 call    _printf
.text:00401648                 add     esp, 4
.text:0040164B                 push    1               ; int
.text:0040164D                 call    _exit
实际上这一段代码并没有被IDA反编译出来. 而loc_401652位置则是一串代码, 亮点在于使用了一个MessageBoxA的函数. 而且函数参数之一就是我们的待解密flag. 那么我们就可以在输入I have a pen.后, 在if ( !v22 )跳转的汇编代码部分, 将其手动改为跳转到flag解密及弹出messagebox的部分运行, 让程序自己帮忙解密并输出, 就可以了.
操作如下图所示:
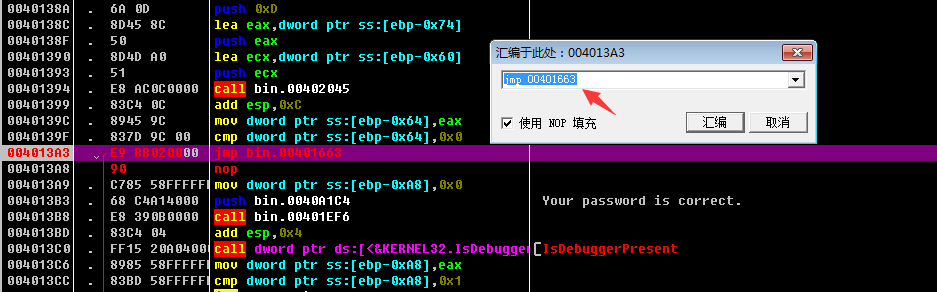
这里是输入I have a pen.后的跳转部分, 因为正常跳转到的部分, 全是一些检测调试的内容, 所以我们直接跳到代码解密的部分. 也就是00401663的位置.
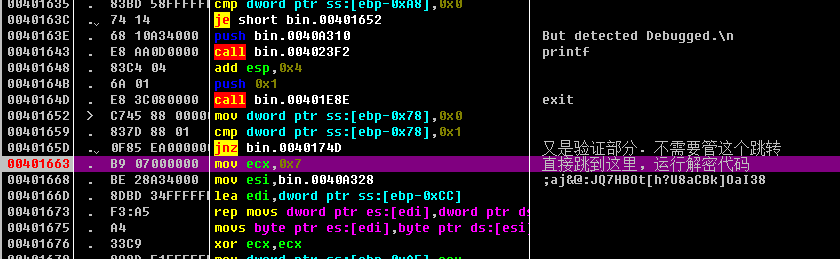
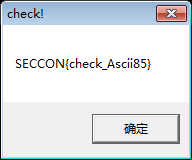
在00401663以上的mov-cmp-jnz也是一个验证部分, 就不管了, 直接跳到00401663这里的mov ecx, 7这里运行解密代码, 并顺着执行MessageBoxA()弹出消息框, 拿到flag
本页面的全部内容在 CC BY-NC-SA 4.0 协议之条款下提供,附加条款亦可能应用。